Usage Metrics Reporting
1. Flow Node Instances (FNI)
What is a “Flow Node Instance”?
The BPMN specification defines a “flow node” as any of the following elements:
- Activities (Tasks and Sub Processes)
- Gateways
- Events
Each process definition will consist of a series of flow nodes. When a specific process instance is executed, instances of these flow nodes are generated, which is why we speak of “flow node instances”.
How can the number of generated flow node instances be estimated?
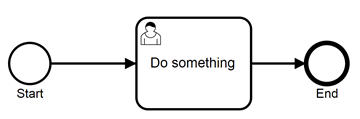
Let’s imagine a very simple process definition, consisting only of a start event, a user task and an end event (see figure above). This contains three flow nodes. If this process is carried out 300,000 times within one year it results in
3 flow nodes * 300.000 process instances \= 900.000 flow node instances.
The process in the figure below, which describes a simple invoice receipt process, is more complicated. The process definition consists of a total of 10 flow nodes:
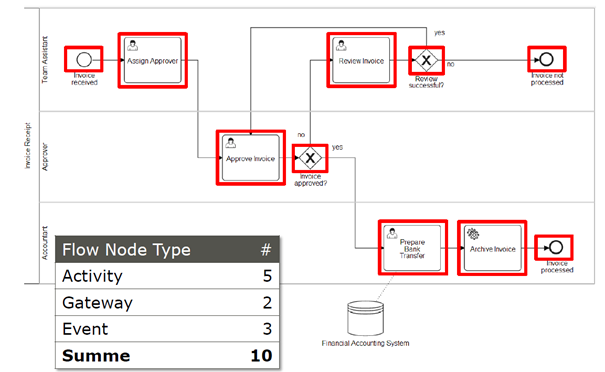
However, each contained flow node will not necessarily be generated per processed invoice (executed process instance). If an invoice is released directly (“approved”), the upper path, which deals with the clarification (“review”) of the bill, is passed. Conversely, it may happen that the upper path is run through more than once, in which case more than 10 flow node instances per processed invoice may arise.
To estimate the flow node instances the probabilities of the XOR gateways are crucial. Figure X assumes certain probabilities and deduces how many flow node instances are generated by processing 10,000 invoices.
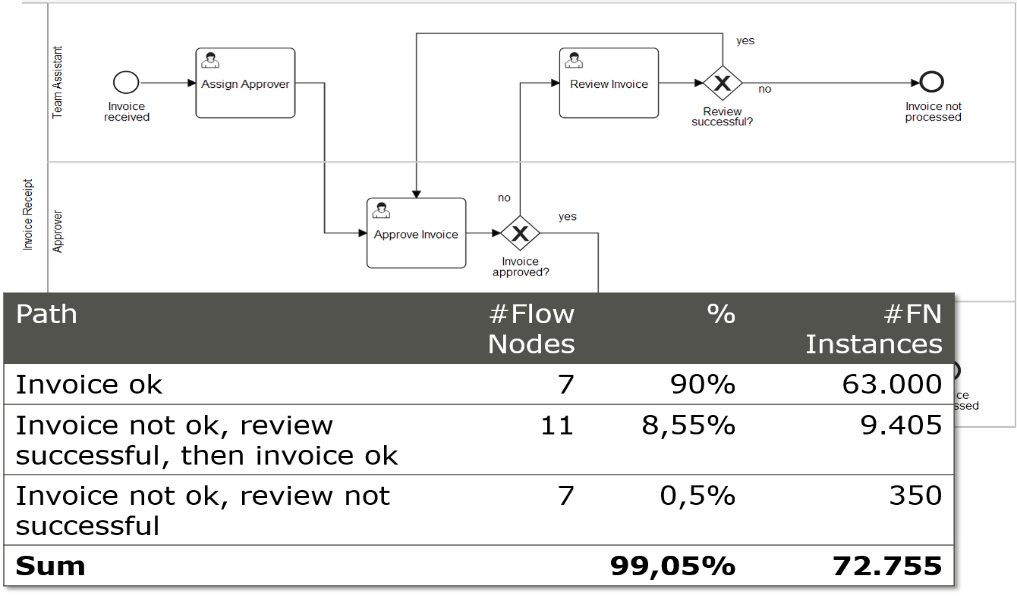
Strictly speaking, this list is not accurate, as a kind of infinite loop may result. However, the absolute figures show that such aspects in estimating the generated flow node instances can be ignored, since they hardly matter in comparison to the “main path”.
How are flow node instances measured / tested?
When running process instances, the generated flow nodes are counted in the database by Camunda. You can view these counts in the database or specify a time frame in Camunda Admin to find out how many flow node instances were created within this period (see screenshot).
At the end of a contract year, you report the number of generated flow node instances to Camunda.
2. How to determine the current Flow Node Instances (FNI) count?
Option 1: Via Camunda Admin Web Application
- Login into the Camunda Admin Web Application
- Choose the System tab on the upper menu bar
- Choose the Execution Metrics menu item on the left side
- Define the start date and the end date as needed
- Check the box: Display legacy metrics (FNI/EDE)
- The Execution Metrics menu in Admin displays an approximate number of *Flow Nodes Instances (FNI)*, Executed Decision Elements (EDE), Process Instances (PI) and Decision Instances (DI) processed by the engine and Task Users (TU) that were assigned to a user task by the selected contract start date.The page displays the rolling last 12 months metrics in a chart and table. If your contract covers FNI/EDE we still encourage you to share information about all displayed metrics.
- Results to be reported back to Camunda are displayed in section: Annual usage metrics by subscription term.
- To share metrics click on Copy. The copied format consists of two parts as seen below in the example. The top part contains the actual metrics that enterprise customers need to share with Camunda.The second part contains the diagnostics data which provides useful information that helps Camunda to improve support but customers can opt out of sharing it.


Option 2: Via the engine’s REST-API
- Choose a REST client
- Use the following REST call to retrieve the current Flow Node Instances count
According to your subscription period and your timezone, set startDate and endDate, e.g.:
- startDate=2023-01-01T00:00:00.000%2B0100: 01/01/2023, 00:00:00, UTC+0100
- endDate=2023-12-31T23:59:59.999%2B0100: 31/12/2023, 23:59:59, UTC+0100
Submit the following request.
GET http://[CAMUNDA_REST_ENDPOINT]/metrics/activity-instance-start/sum?startDate=2023-01-01T00:00:00.000%2B0100&endDate=2023-12-31T23:59:59.999%2B0100The response contains the FNI count from the time period defined.

Option 3: Via the engine’s Java-API
- Use the Management Service in order to query the current FNI count.
According to your subscription period and your timezone, set startDate and endDate, e.g.: startDate=2023-01-01T00:00:00: 01/01/2023, 00:00:00 endDate=2023-12-31T23:59:59: 31/12/2023, 23:59:59
 DateFormat dateFormat = new SimpleDateFormat("yyyy-MM-dd'T'HH:mm:ss");
 Date startDate = dateFormat.parse("2023-01-01T00:00:00");
 Date endDate = dateFormat.parse("2023-12-31T23:59:59");

 long fni2023 = managementService()
   .createMetricsQuery()
   .name("activity-instance-start")
   .startDate(startDate)
   .endDate(endDate)
   .sum();
The query result contains the value of the FNI count from the time period defined.
Option 4: Via direct Database query
Prepare a native DB query to Camunda’s table ACT_RU_METER_LOG. Use this template:
 SELECT SUM(VALUE_) AS FNI_COUNT
 FROM ACT_RU_METER_LOG
 WHERE NAME_ = 'activity-instance-start'
   AND TIMESTAMP_ >= [START_DATE]
   AND TIMESTAMP_ <= [END_DATE]
The field TIMESSTAMP_ is of type TIMESTAMP. Make sure to substitute the placeholders START_DATE and END_DATE with a function call that creates valid TIMESTAMP values for your specific DBMS to define your subscription period boundaries.
The query result contains the FNI count from the time period defined.
3. Executed Decision Elements (EDE)
What is an executed decision element (EDE)?
If you use the decision engine for executing DMN, you will create decision tables.
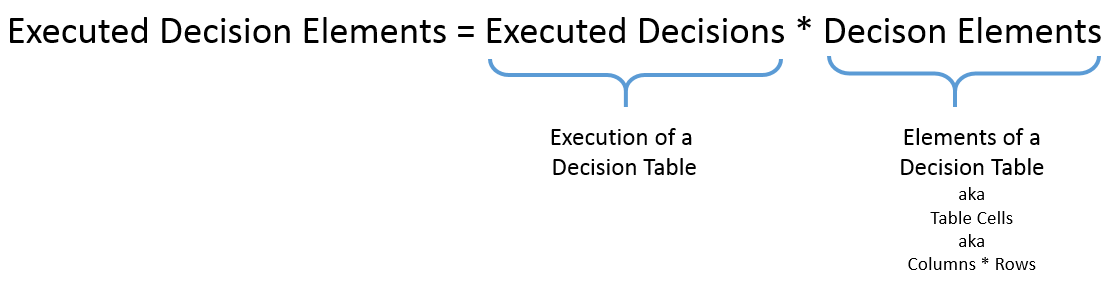
A decision table consists of columns and rows, multiplying those gives the number of “cells” or “decision elements”.
The so-called “Executed Decision Elements” (EDE) are the result of the number of decision element and the number of executions of each decision table.
How can the number of executed decision elements be estimated?
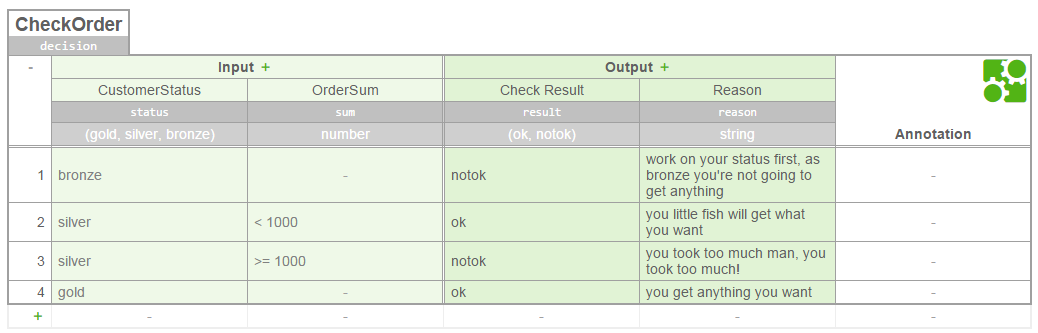
The table above consists of 2 input columns and 2 output columns, making a total of 4 columns (The annotation column is not counted).
It also consists of 4 rows (The rows that serve the mapping, are not counted). This results in 16 decision elements.
Depending on the number of induced decisions (i.e. executions of the table), the following executed decision elements (EDE) arise as an example: Decision Elements (EDE):
| Number of executions | Executed decision elements |
|---|---|
| 1,000 | 16,000 |
| 10,000 | 160,000 |
| 100,000 | 1,600,000 |
Note: To determine the number of executed decision elements, it is irrelevant whether a single rule was actually tested in a particular table execution.
How are executed decision elements measured / tested?
During the execution of the decision tables, the executed decision elements are counted in the database. You can see the counts in the database or specify a time frame in Camunda Admin to find out how many executed decision elements were created within this period.
At the end of a contract year, you report the number of generated executed decision elements to Camunda.
4. How to determine the current Executed Decision Elements (EDE) count?
Option 1: Via Camunda Admin Web Application
- Login into the Camunda Admin Web Application
- Choose the System tab on the upper menu bar
- Choose the Execution Metrics menu item on the left side
- Define the start date and the end date as needed
- Check the box: Display legacy metrics (FNI/EDE)
- The Execution Metrics menu in Admin displays an approximate number of *Flow Nodes Instances (FNI), Executed Decision Elements (EDE), Process Instances (PI) and Decision Instances (DI) processed by the engine and Task Users (TU) that were assigned to a user task by the selected contract start date.The page displays the rolling last 12 months metrics in a chart and table. If your contract covers FNI/EDE we still encourage you to share information about all displayed metrics.
- Results to be reported back to Camunda are displayed in section: Annual usage metrics by subscription term.
- To share metrics click on Copy. The copied format consists of two parts as seen below in the example. The top part contains the actual metrics that enterprise customers need to share with Camunda.The second part contains the diagnostics data which provides useful information that helps Camunda to improve support but customers can opt out of sharing it.

Option 2: Via the engine’s Java-API
- Use the Management Service in order to query the current EDE count:
According to your subscription period and your timezone, set startDate and endDate, e.g.:
startDate=2023-01-01T00:00:00: 01/01/2023, 00:00:00endDate=2023-12-31T23:59:59: 31/12/2023, 23:59:59SimpleDateFormat formatter = new SimpleDateFormat("yyyy-MM-dd'T'HH:mm:ss"); Date startDate = formatter.parse("2023-01-01T00:00:00"); Date endDate = formatter.parse("2023-12-31T23:59:59"); long ede2023 = managementService.createMetricsQuery() .name("executed-decision-elements") .startDate(startDate) .endDate(endDate) .sum();The query result contains the value of the EDE count from the time period defined.
Option 3: Via direct Database query
Prepare a native DB query to Camunda’s table ACT_RU_METER_LOG. Use this template:
SELECT SUM(VALUE_) AS EDE_COUNT
FROM ACT_RU_METER_LOG
WHERE NAME_ = 'executed-decision-elements'
 AND TIMESTAMP_ >= [START_DATE]
 AND TIMESTAMP_ <= [END_DATE]
The field TIMESSTAMP_ is of type TIMESTAMP. Make sure to substitute the placeholders START_DATE and END_DATE with a function call that creates valid TIMESTAMP values for your specific DBMS to define your subscription period boundaries.
The query result contains the EDE count from the time period defined.
5. Metric Definition: Process & Decision Instances/Task Users (RPI/PI, EDI/DI, UTW/TU)
| Metric | What it means | How it is technically measured |
|---|---|---|
| Root Process Instances (RPI/PI) | What is the annual transaction volume of the process? | Technical execution of a BPMN Process Definition in the Camunda Workflow Engine, independent of current status (pending or completed). Additional process instances that are invoked via call activities are not counted separately. The number of root process instance executions started. This is also known as process instances (PI). A root process instance has no parent process instance, i.e. it is a top-level execution. |
| Unique Task Workers (UTW/TU) (Task Users) | How many people will directly interact with the process? | Distinct string that has been assigned to a User Task in the Camunda history. Each string will be counted once, i.e. if the same user has been assigned to more than one task during the contractual year, this will be only counted once. The number of task users (TU) that have served as assignees. Note: this is also true in a multi-tenant setup (using Tenant Identifiers): a user with a given username is counted once even if they were assigned tasks belonging to different tenants. Important: If you are not running Tasklist or Operate, there is currently no way to retrieve usage metrics until future releases. Regardless, the metrics still need to be factored into any enterprise agreement and count towards any task user pricing. |
| Executed Decision Instances (EDI/DI) | Will you automate decisions using DMN as part of the workflow? How many decision tables will be in the process? | Technical execution of a DMN Decision Model (e.g., a decision table) in the Camunda Decision Engine. Executions of single models as part of a composed decision model (e.g., in a DRD) will be counted separately. The number of evaluated decision instances (DI). A decision instance is a [DMN decision table](https://docs.camunda.io/docs/8.1/components/modeler/dmn/decision-table/) or a [DMN literal expression](https://docs.camunda.io/docs/8.1/components/modeler/dmn/decision-literal-expression/). In a Decision Requirements Diagram (DRD) each evaluated decision table or expression is counted separately. |
6. How to determine the current usage (RPI/PI, EDI/DI, UTW/TU)?
Option 1: Via Camunda Admin Web Application
Note: RPI/EDI available in version 7.13.0 and above. UTW count available in 7.13.6 and 7.14.0 or above
- Login into the Camunda Admin Web Application
- Choose the System tab on the upper menu bar
- Choose the Execution Metrics menu item on the left side
- Define the start date and the end date as needed
- If you use Camunda 7.13.6 to 7.16, please check the box: Show unique Task Workers (UTW) metric visible in your System Tab
- The Execution Metrics menu in Admin displays an approximate number of *Flow Nodes Instances (FNI)*, Executed Decision Elements (EDE), Process Instances (PI) and Decision Instances (DI) processed by the engine and Task Users (TU) that were assigned to a user task by the selected contract start date.The page displays the rolling last 12 months metrics in a chart and table. If your contract covers FNI/EDE we still encourage you to share information about all displayed metrics.
- Results to be reported back to Camunda are displayed in section: Annual usage metrics by subscription term.
- To share metrics click on Copy. The copied format consists of two parts as seen below in the example. The top part contains the actual metrics that enterprise customers need to share with Camunda.The second part contains the diagnostics data which provides useful information that helps Camunda to improve support but customers can opt out of sharing it.

Option 2: Via the engine’s REST-API
Note: Available in version 7.13.0 or above
- Choose a REST client
- Use the following REST call to retrieve the current RPI/EDI count
- According to your subscription period and your timezone, set startDate and endDate, e.g.: startDate=2023-01-01T00:00:00.000%2B0100: 01/01/2020, 00:00:00, UTC+0100 endDate=2023-12-31T23:59:59.999%2B0100: 31/12/2020, 23:59:59, UTC+0100
Submit the following request.
Metric REST API Call Root Process Instances (RPI) GET http://[CAMUNDA_REST_ENDPOINT]/metrics/root-process-instance-start/sum?startDate=2023-01-01T00:00:00.000%2B0100&endDate=2023-12-31T23:59:59.999%2B0100Unique Task Workers (UTW) (Task Users) GET http://[CAMUNDA_REST_ENDPOINT]/metrics/task-users/sum?startDate=2023-01-01T00:00:00.000%2B0100&endDate=2023-12-31T23:59:59.999%2B0100Executed Decision Instances (EDI) GET http://[CAMUNDA_REST_ENDPOINT]/metrics/executed-decision-instances/sum?startDate=2023-01-01T00:00:00.000%2B0100&endDate=2023-12-31T23:59:59.999%2B0100The response contains the metric count from the time period defined.
Option 3: Via direct Database query
Note: Available in version 7.13.0 or above
- Please adjust the query according to your own need, in case you are using a different database (e.g. date format used in DB)
- Adjust the start and end date in the statement, to retrieve the correct date range as needed
| Metric | SQL Select Statement Example |
|---|---|
| Root Process Instances (RPI) | SELECT SUM(VALUE_) AS RPI_COUNT FROM ACT_RU_METER_LOG WHERE NAME_='root-process-instance-start' AND TIMESTAMP_ >= [START_DATE] AND TIMESTAMP_ <= [END_DATE] |
| Unique Task Workers (UTW) (Task Users) | SELECT COUNT(DISTINCT ASSIGNEE_HASH_) FROM ACT_RU_TASK_METER_LOG WHERE TIMESTAMP_ >= [START_DATE] AND TIMESTAMP_ <= [END_DATE] |
| Executed Decision Instances (EDI) | SELECT SUM(VALUE_) AS EDI_COUNT FROM ACT_RU_METER_LOG WHERE NAME_='executed-decision-instances' AND TIMESTAMP_ >= [START_DATE] AND TIMESTAMP_ <= [END_DATE] |
Determining RPI/UTW/EDI usage from History Table
Note: Should be used for versions below 7.13.0
- Technically based on H2 DB, so please adjust the query, in case you use a different database (especially how the date is formatted)
- By changing start and end date in statement, any period of time can be used to count metrics
- If History Cleanup is enabled, the numbers might not reflect the accurate usage, due to data being removed periodically
| Metric | SQL Select Statement |
|---|---|
| Unique Task Workers (UTW) (Task Users) | SELECT count(distinct assignee_) FROM ACT_HI_TASKINST WHERE start_time_ BETWEEN '2023-01-01' AND '2023-12-31' AND assignee_ IS NOT NULL |
| Root Process Instances (RPI) | SELECT count(*) FROM ACT_HI_PROCINST WHERE start_time_ BETWEEN '2023-01-01' AND '2023-12-31' AND super_process_instance_id_ IS NULL |
| Executed Decision Instances (EDI) | SELECT count(*) FROM ACT_HI_DECINST WHERE eval_time_ BETWEEN '2023-01-01' AND '2023-12-31' |