Dashboard
The processes dashboard of Cockpit is the entry point for process monitoring. It comes with a pre-installed plugin, which lets you see deployed process definitions. Additional plugins can be added to the processes dashboard.
Deployed Processes

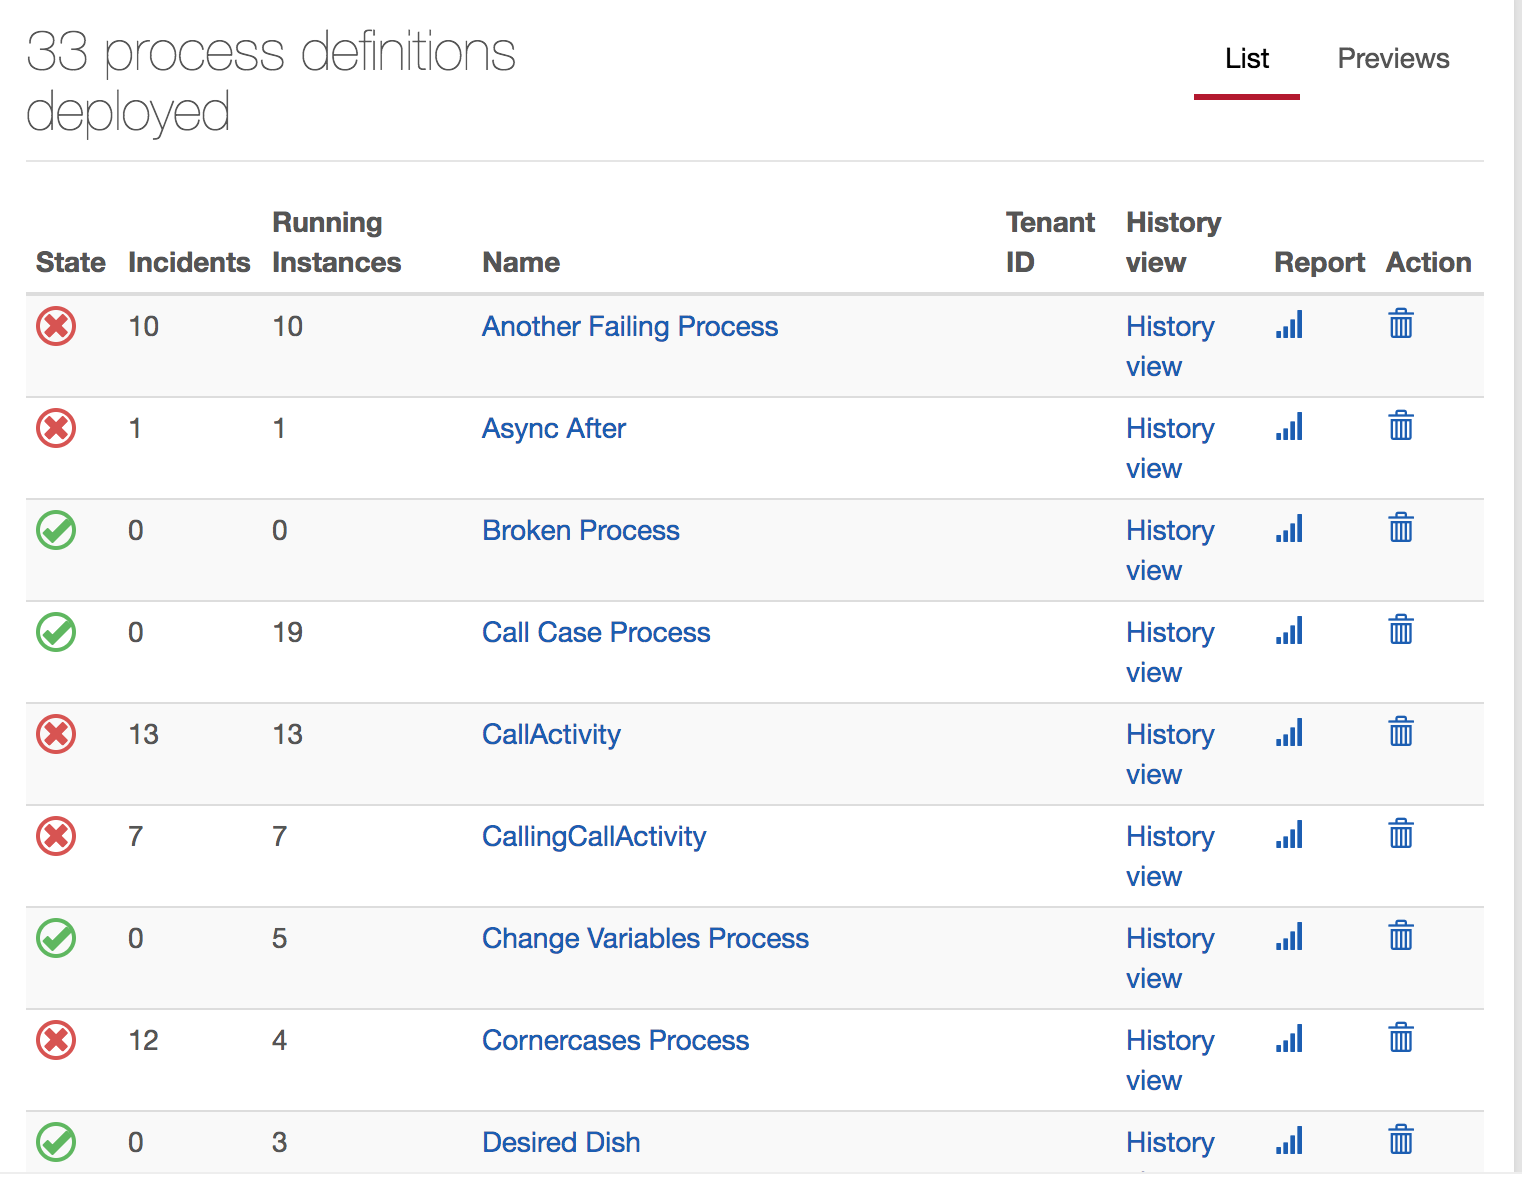
With this plugin you can easily observe the state of a process definition. Green and red dots signalize running and failed jobs. At this observing level a red dot signifies that there is at least one process instance or a sub process instance which has an unresolved incident. You can localize the problem by using the process definition view.

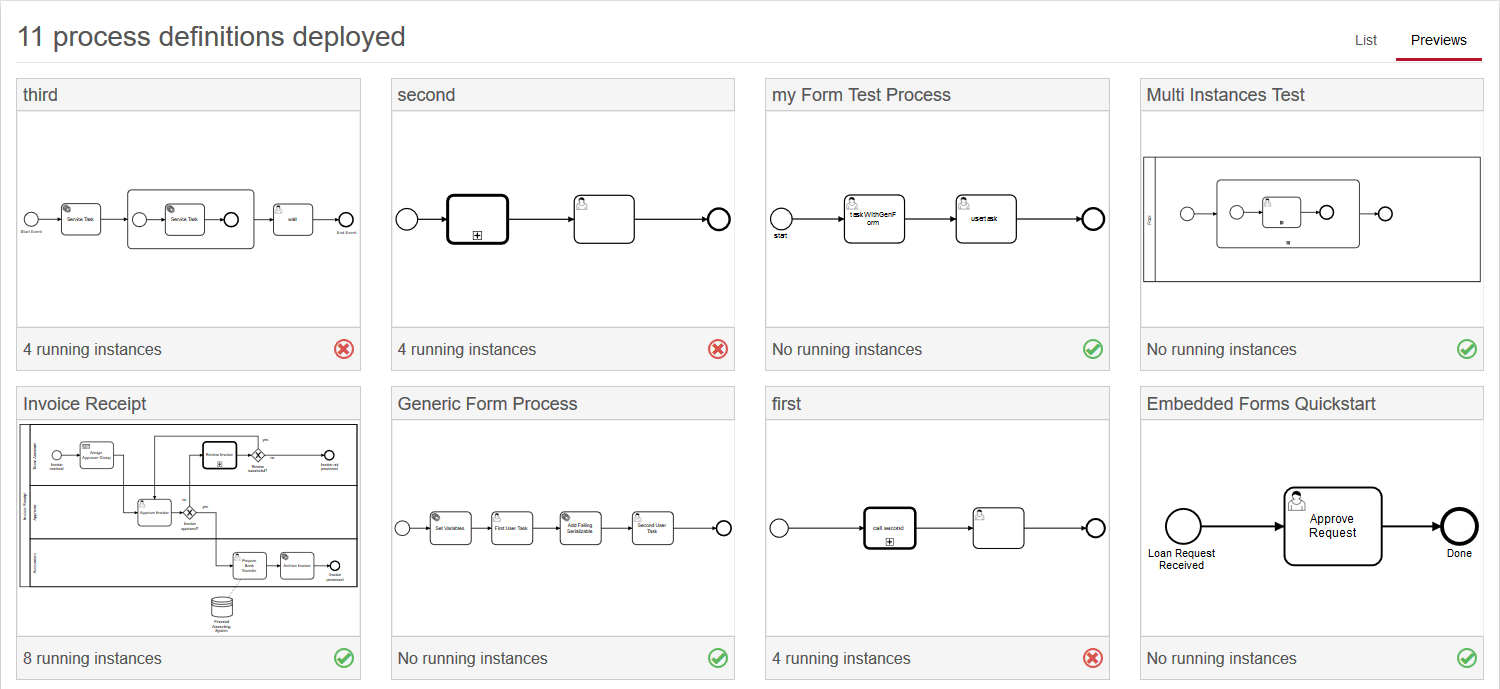
You can also switch to the preview tab which displays the rendered process model of each deployed process. Additionally, you get information about how many instances of the process are currently running and about the process state. Green and red dots signalize running and failed jobs. Click on the model to go to the process definition view.
Search
Enterprise Feature
Please note that this feature is only included in the enterprise edition of the Camunda BPM platform, it is not available in the community edition.
Check the Camunda enterprise homepage for more information or get your free trial version.

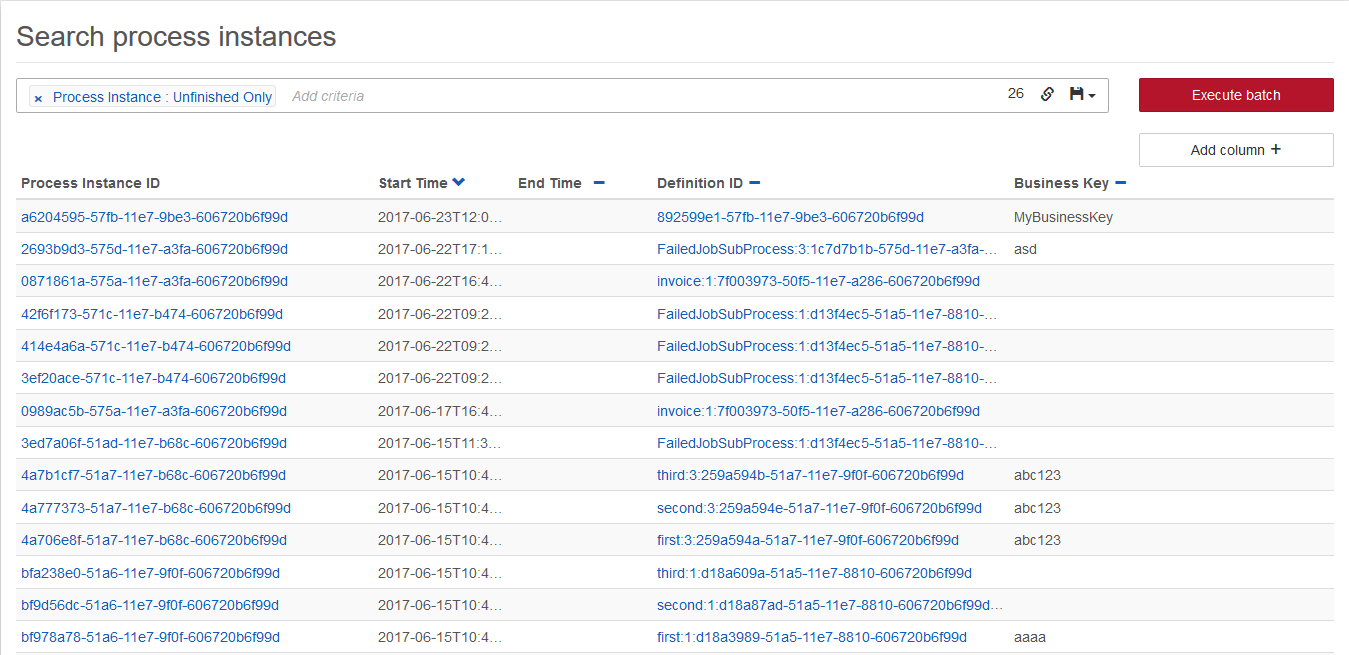
At the top of the dashboard, you can search for process instances and incidents which fulfill certain search criteria. To do so, click in the search box and select the parameters to search for. You can also begin typing to find the required parameter faster. Depending on the selected property, you have to specify the value of the property. Some properties also allow operators other than equal, e.g., ‘like’, which allows searching for process instances where the entered value is a substring of the property value. To search for process variables, you also have to enter the variable name you want to search for. You can search for variable values with the type String, Number, or Boolean. To search for a variable of type string, which has a numeric, boolean or null value, you have to wrap the value in single quotes (e.g., '93288' or 'NULL'). You can combine multiple search pills to narrow down the search results.
To add additional columns to the details of the search results, click on the ‘Add column’ button and select the desired details in the drop down menu that appears.
Furthermore, you can copy a link to the current search query to your clipboard by clicking on the button and you can save search queries to your local browser storage by clicking on the button and inserting a name in the drop down menu that appears. You can then retrieve the search query by clicking on the button and selecting the chosen name in the drop down menu.
You can always either search for process instances or for incidents. When you add a parameter for an incident search, you can not add a second parameter which would search for a process instance and vice versa.
You can perform batch operation on process instances matching search criteria by clicking “Batch operation” button.
Heads-up!
The process instance search operates on the history endpoint of the engine. In case the requested historic data is not persisted to the database, then the search does not deliver the desired results.
Delete Process Definitions
Enterprise Feature
Please note that this feature is only included in the enterprise edition of the Camunda BPM platform, it is not available in the community edition.
Check the Camunda enterprise homepage for more information or get your free trial version.

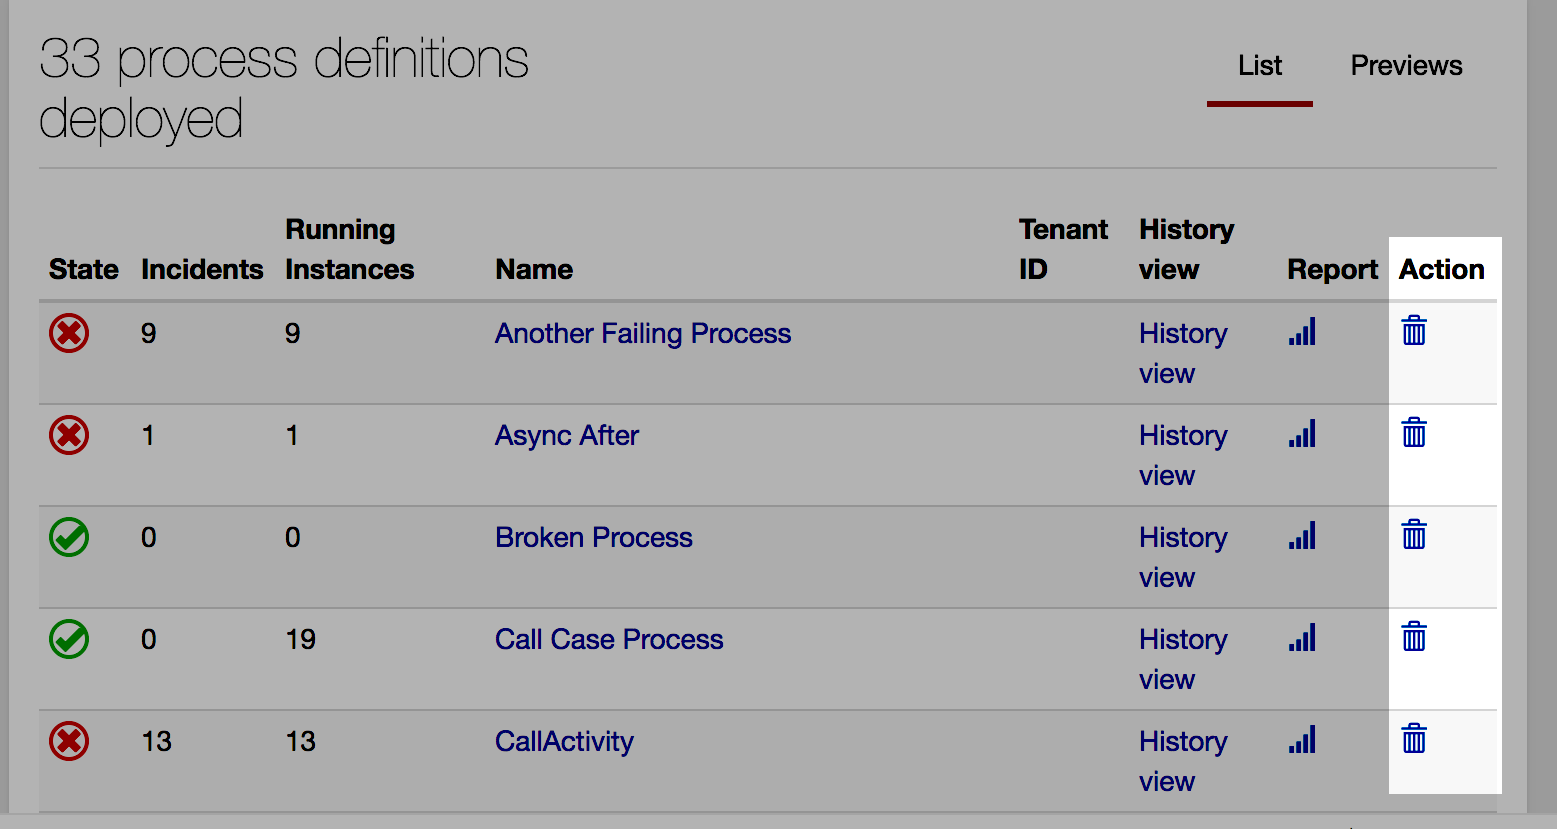
Each process definition in the dashboard has a delete action. This action allows to delete all versions of a process definition. When proceeding with this action, you can always choose to enable/disable skipping custom listeners. However, if the process definition has process instances running, enabling the cascading flag becomes mandatory.