Event Based Processes
Heads Up!
You need to setup the Event Based Processes feature to make use of it. See here for more information
Event Based Processes are BPMN processes that can be created inside Optimize which are based on events. These events can be loaded from an external system or created from internal BPMN processes. They are particularly useful to create reports and dashboards based on a process that is not fully automated with Camunda BPM yet.
Once the Event based processes feature is correctly configured, you will see a new link in the navigation to go to Event based processes list. From there, you can see, create, edit or update your event based processes.
You can create a process in two ways, one way is to model the process manually yourself using the integrated BPMN modeler. Another way is to upload a BPMN model directly into optimize.
The process itself consists of the edit mode and the view mode:
Edit Mode
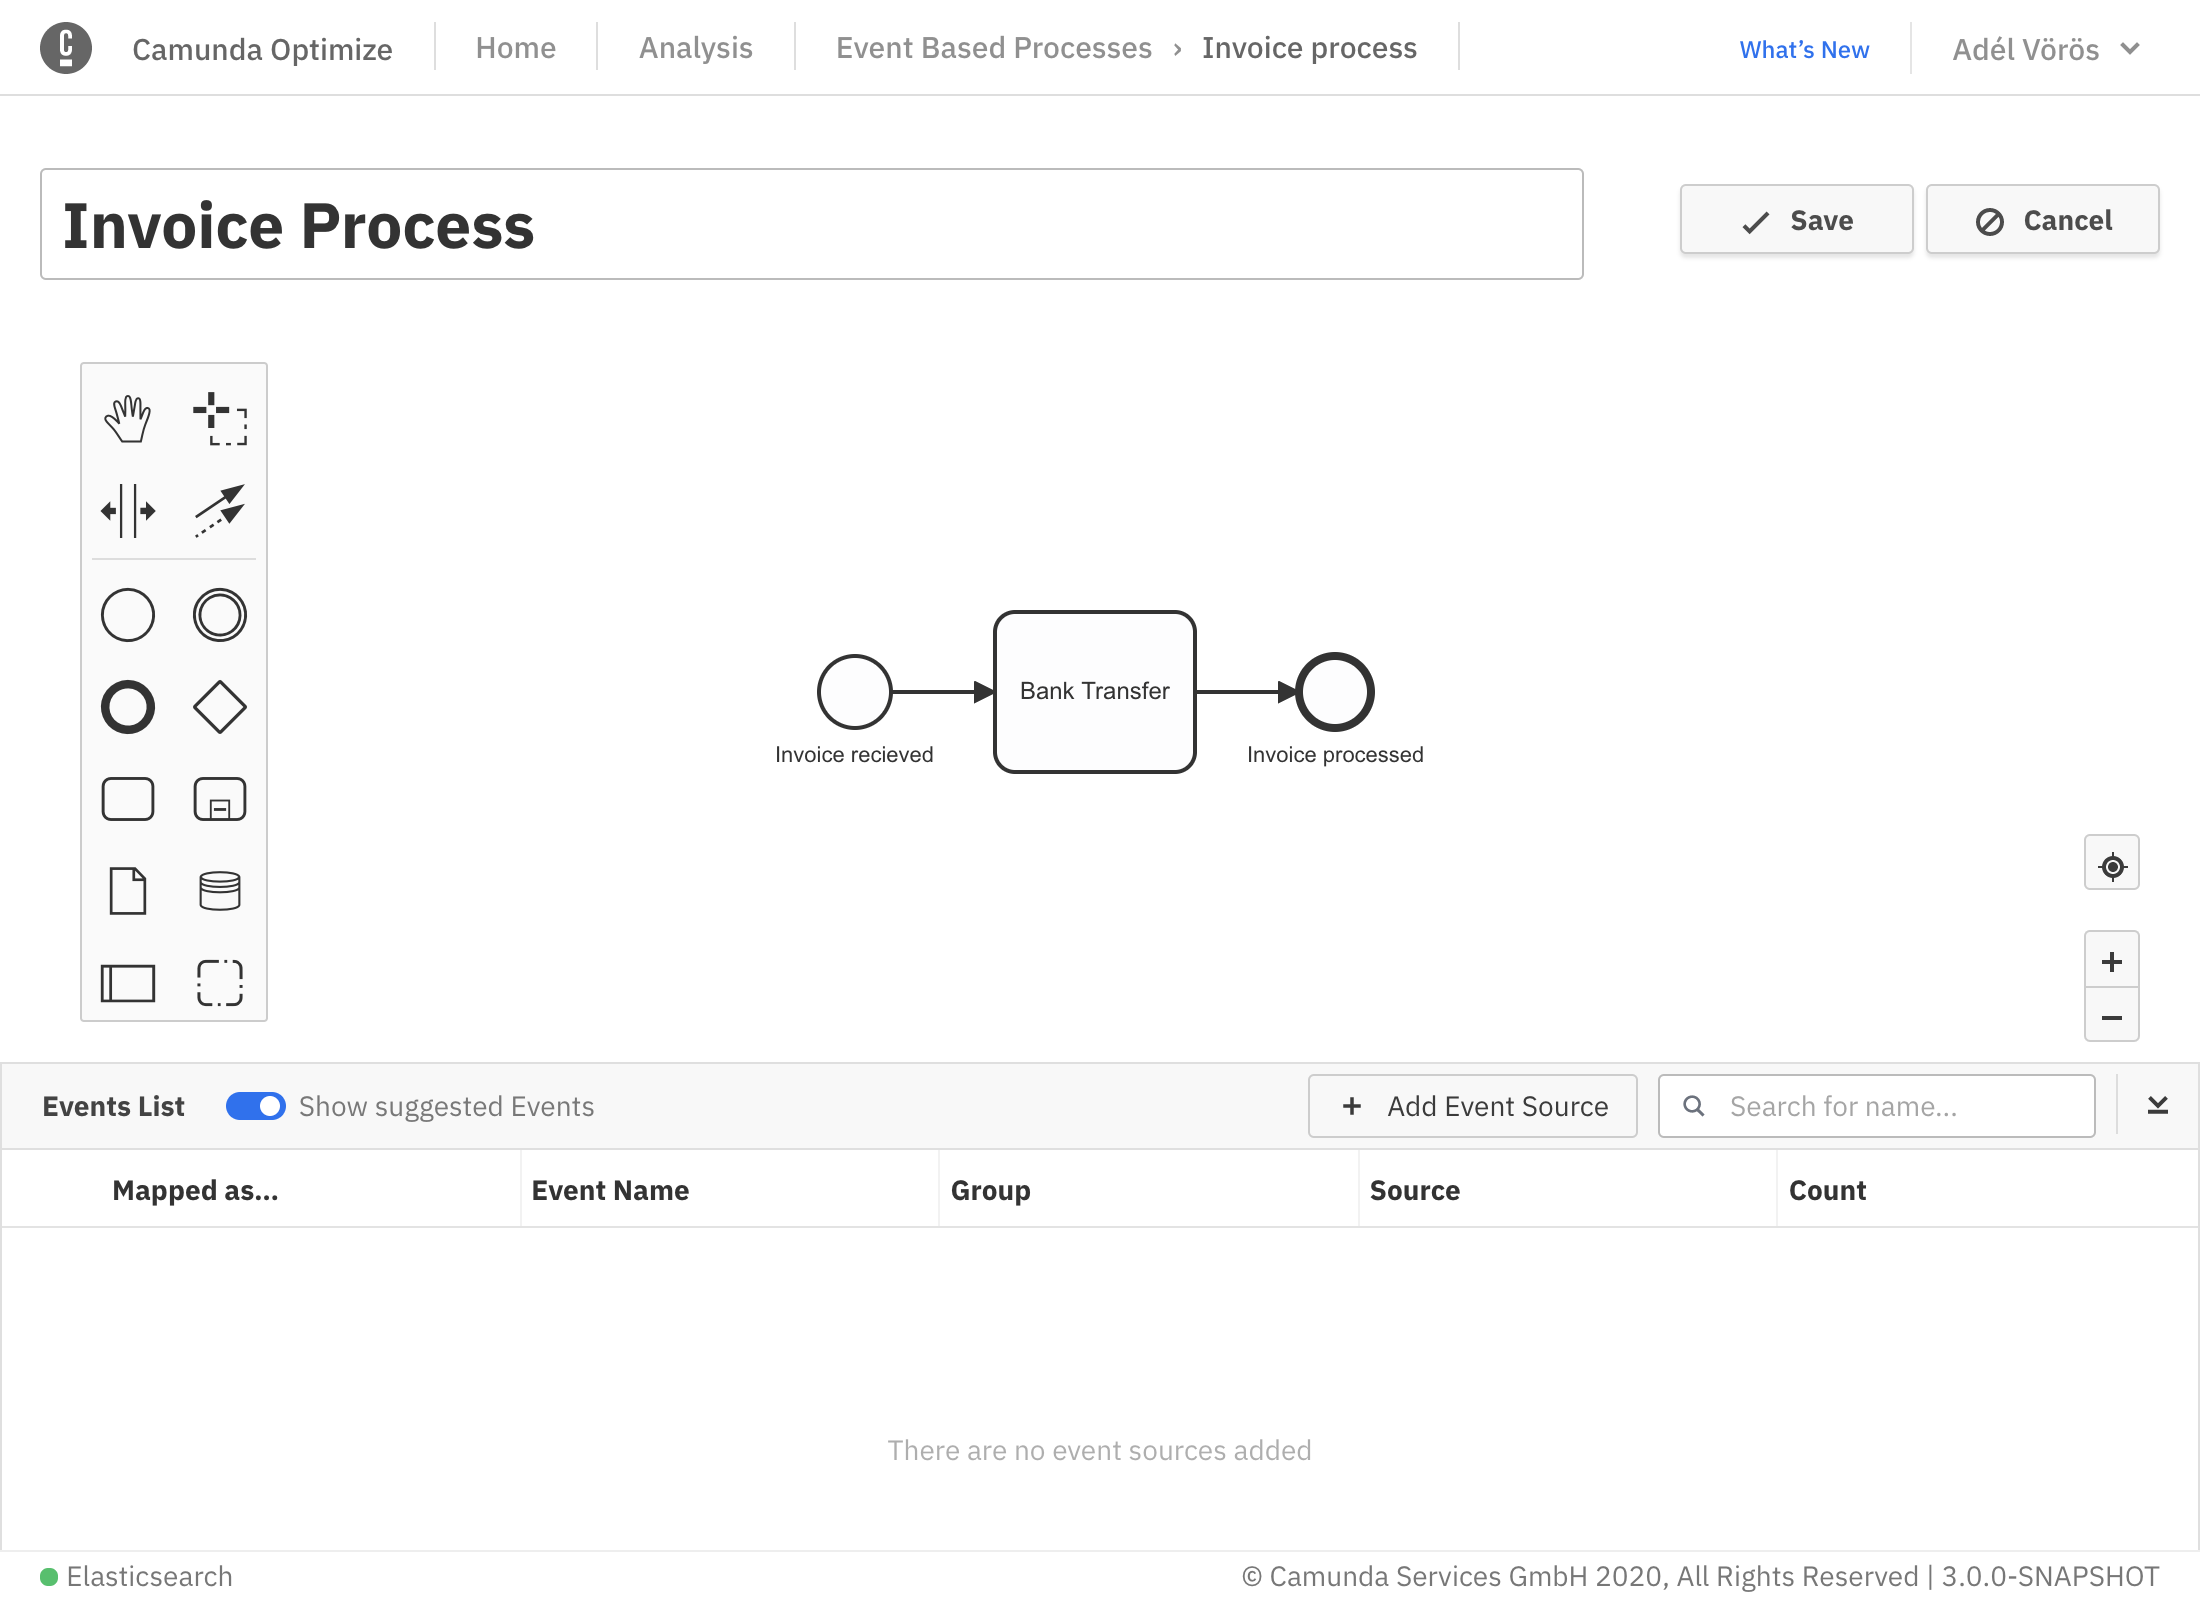
The edit mode allows you to build and map your event based process. Using this mode, you can perform all kinds of changing operations such as:
- Rename the process
- Model the process using the integrated BPMN modeler
- Map your diagram nodes to an event from the event table
- Save the current state with your applied changes
- Cancel changes you already applied to the process
Modeling
Modeling can be done using the integrated modeler shown in the screenshot above. To maximize the modeling area, you can collapse the table during the modeling by clicking on the collapse button in the top right of the table.
Event sources
In order to be able to map BPMN nodes to events, you have to add event sources to the process first. To do that, click the Add Event Sources button available on the top of the table.
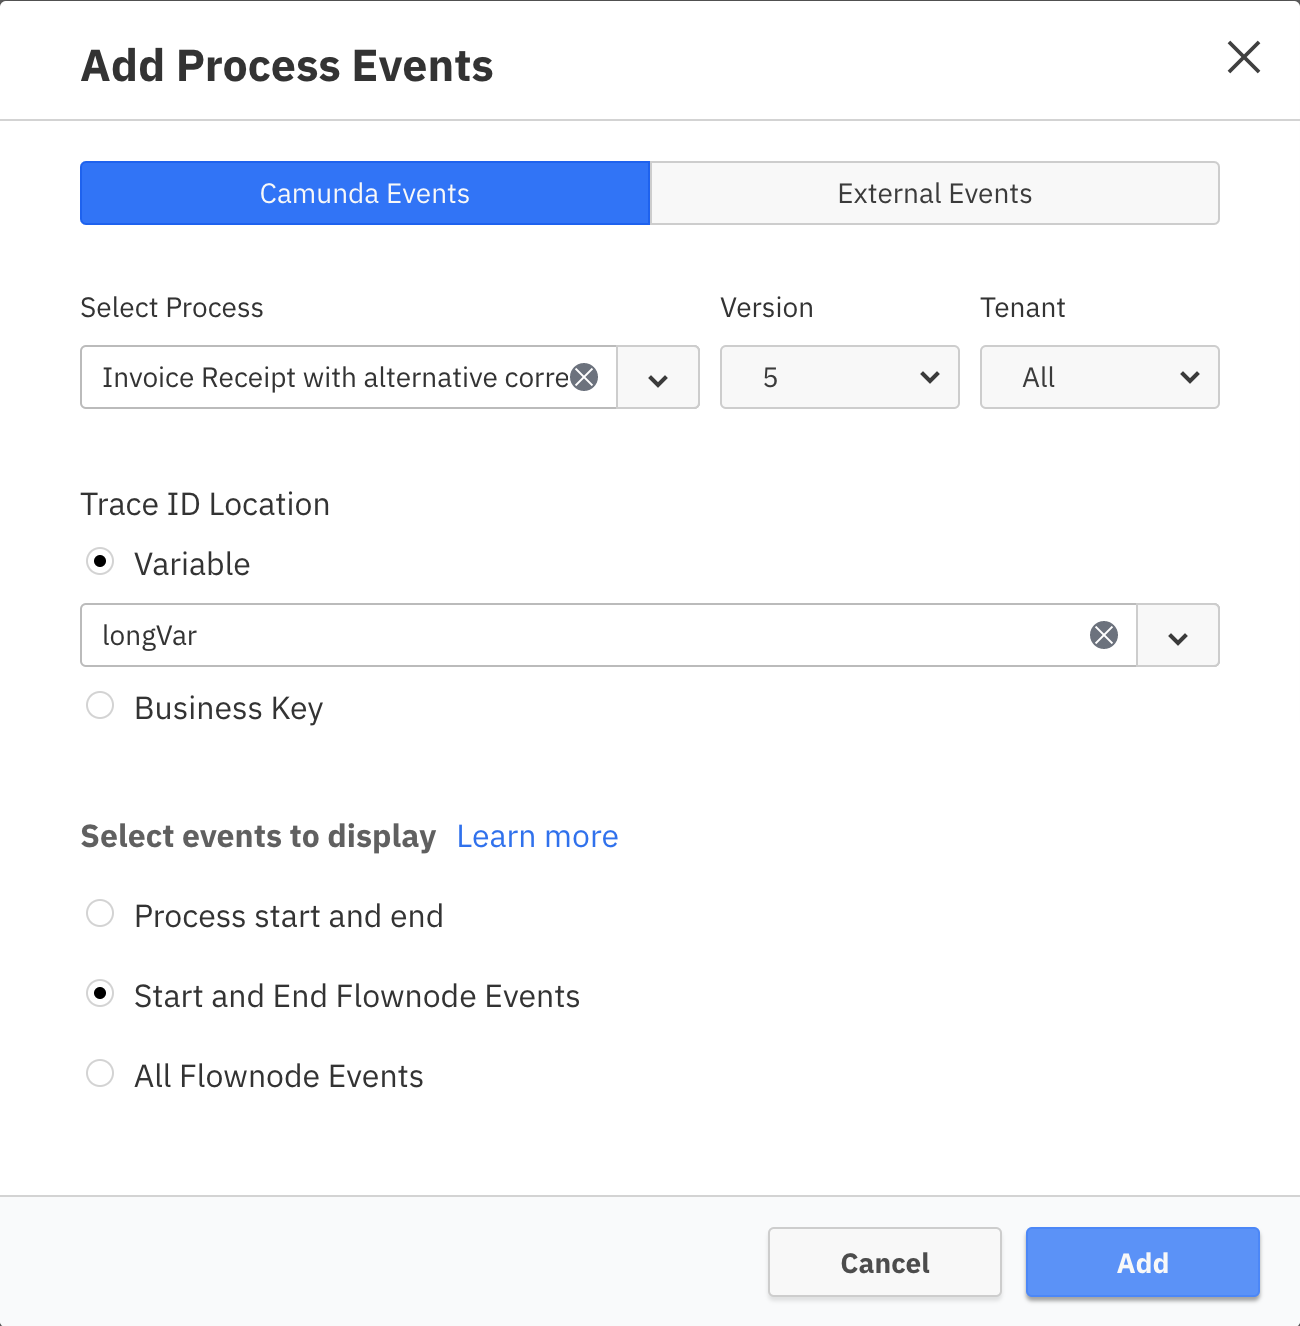
In this view, it is possible to add two types of events into Optimize:
External Events:
Events that were ingested into Optimize from an external system, These events can be imported into optimize using the event ingestion API that Optimize provides.
Camunda Events:
These are events generated from an existing Camunda BPMN process.
To add such events, you need to provide the following details:
The target process definition that you would like to generate the events from
The trace ID location: A trace id uniquely identifies a process instance across system boundaries. One example would be an invoice number for an invoice handling process. For a Camunda process, it is possible to select a trace id that exists either in a variable or in the process business key.
Which Events to display in the table: Adding events for every flow node might not be necessary for the event based process. Therefore, we provide the ability to only add the events that are necessary. There are three options available:
Process start and end: This will add only two events in the table, one event is triggered when the process starts and one when it ends.
Start and End Flownode Events: the number of events added to the table will depend on how many start and end events are in the process. e.g if there is one start event and two end events, three events will be added.
Start and End Flownode Events: This option will add events for every flow node in the process.
Once these information are defined and the sources are added, these events will appear in the table as shown below.

Events Table
Each event in the table will have the following properties:
Mapped as (start/end): defines whether the event indicates start of BPMN node or the end of it.
Event Name
Group
- for external events, this defines group of the ingested event.
- for camunda process events, this define the name of the process definition.
Source: external system or Camunda process event
Count: how many times this event was triggered.
As assistance during event mapping, the events table offers suggestions of potential events to be mapped based on the selected node. This is indicated by a blue strap near the suggested event. The event suggestion only works for external events.
Mapping Events:
Mapping is the process of linking BPMN flownodes to events. To start mapping, select the node that you would like to map from the diagram. To link the selected node to an event, simply enable the checkbox of that event from the table. After doing that, a checkmark sign will be shown on top of the node to indicate that the event has been mapped successfully.
Heads Up!
Not all BPMN nodes can be mapped. Only events and activities can be mapped to events.
Once all the necessary nodes are mapped, you can save your diagram to go the view mode.
View Mode:
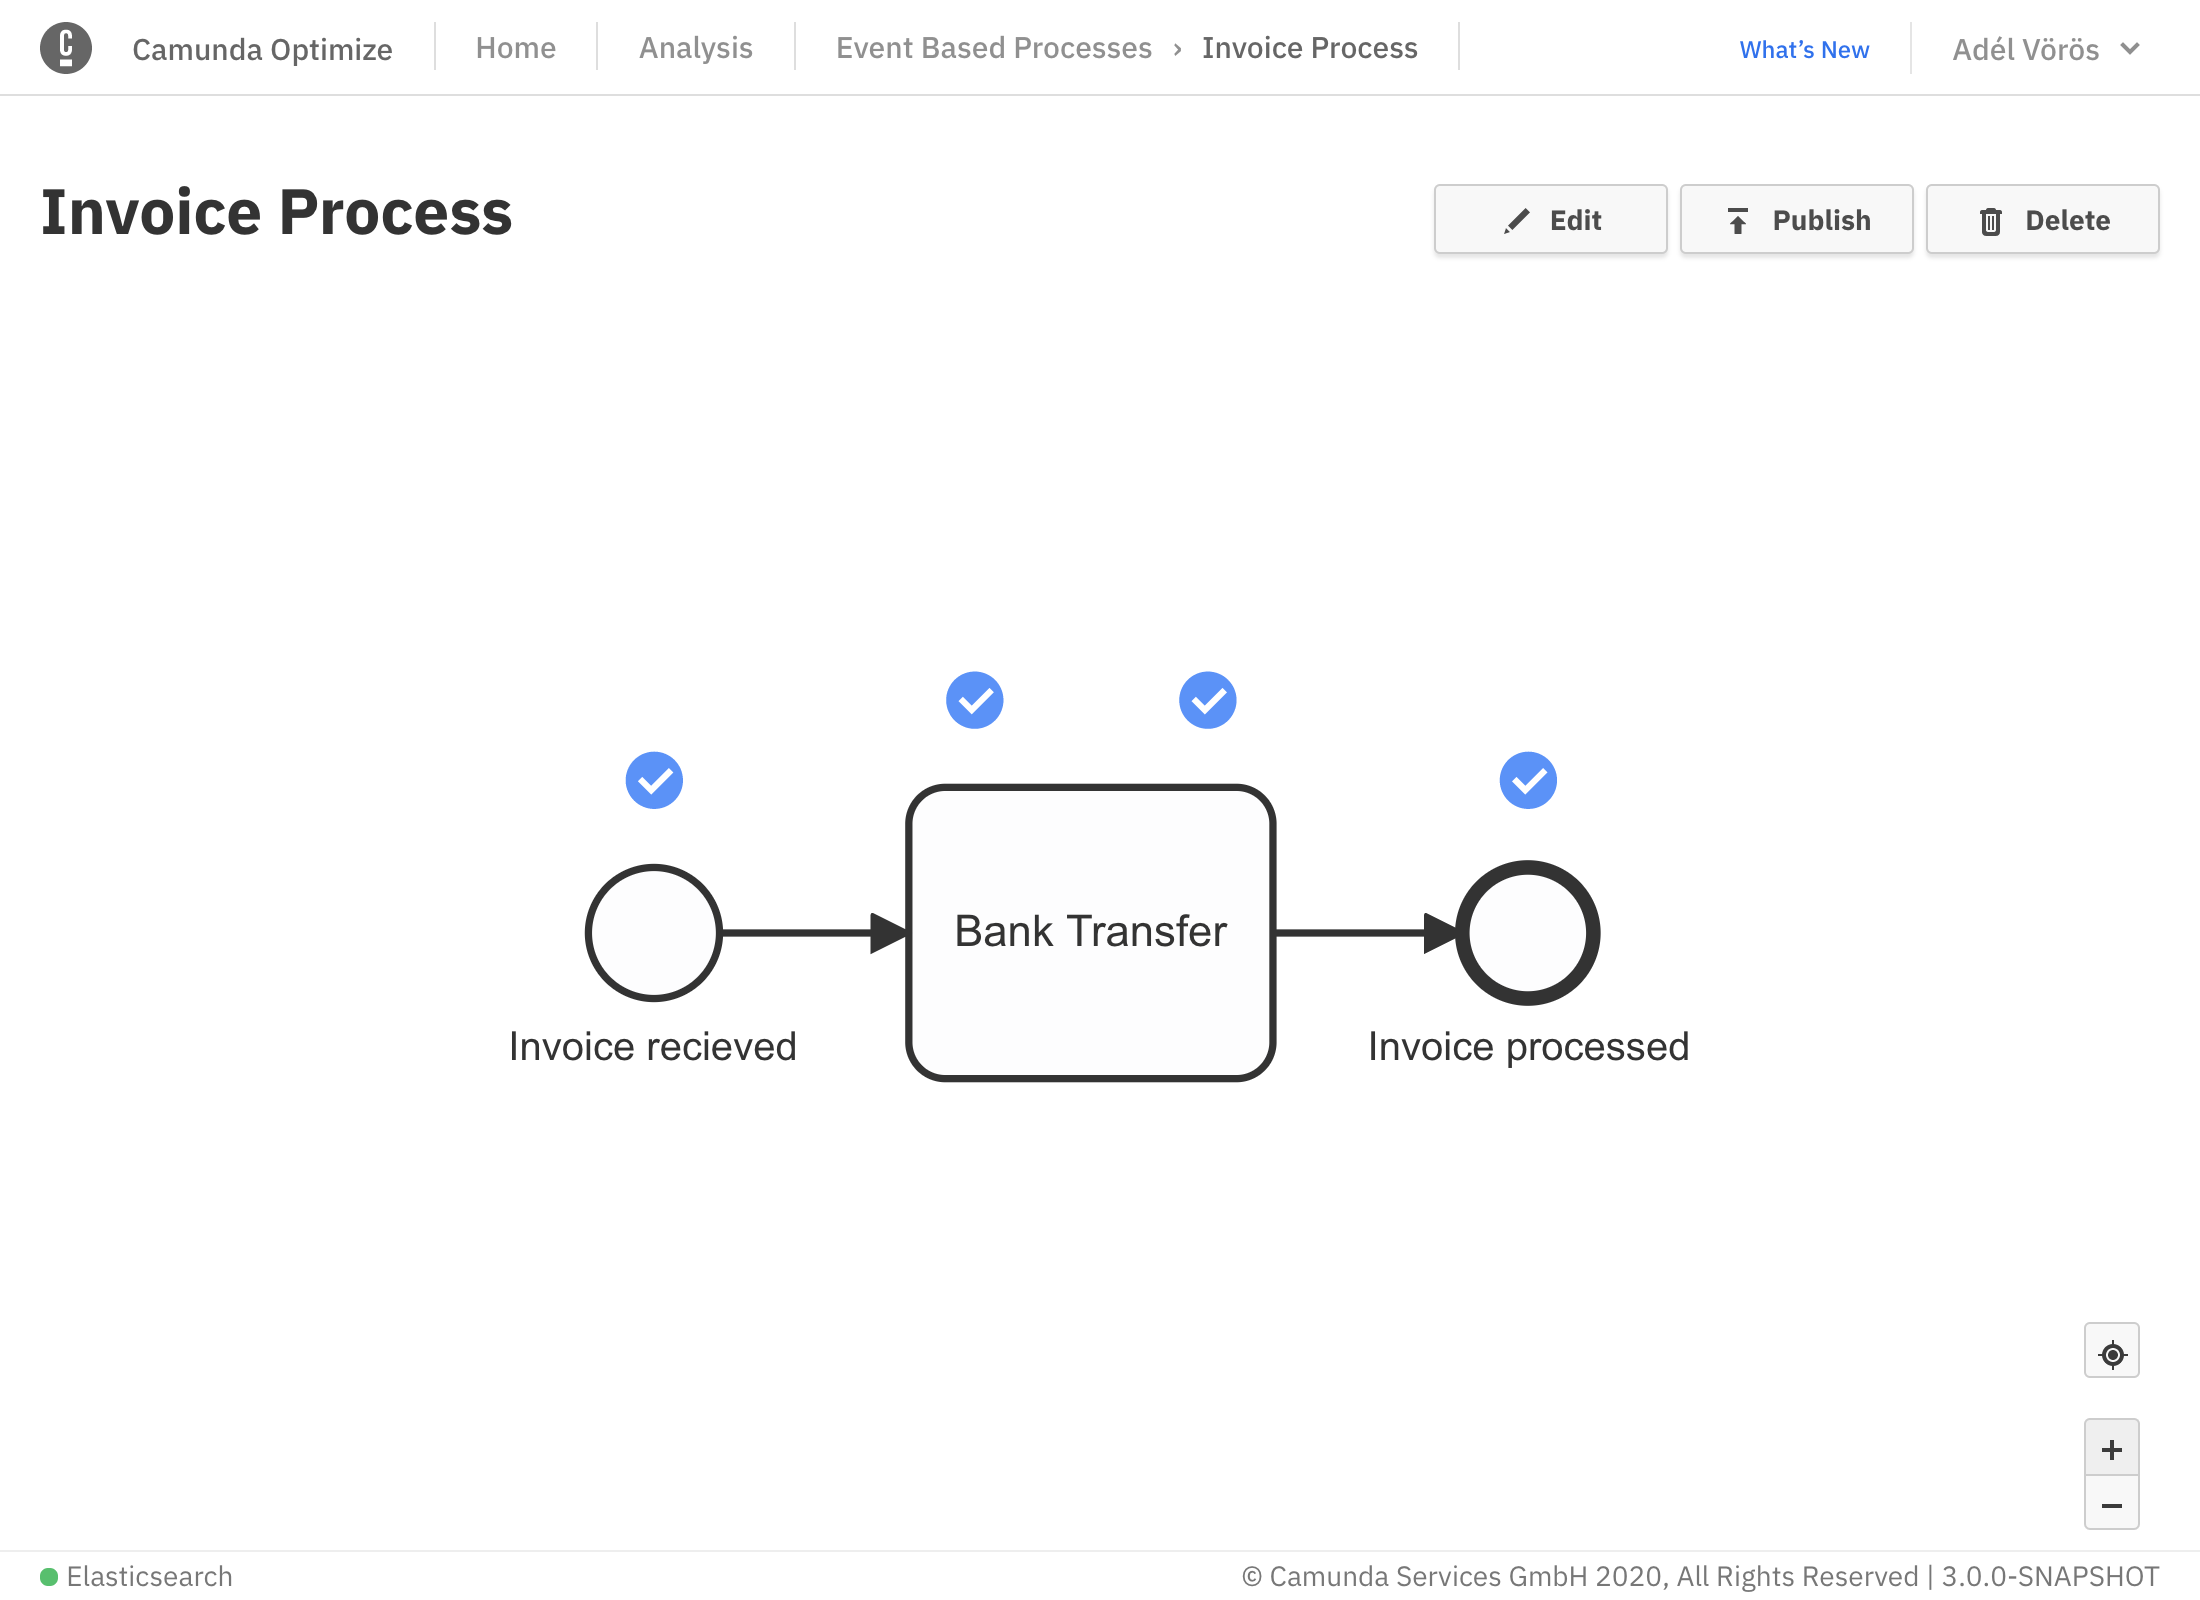
Once you have built and mapped your event based process, you need to publish it to be used for creating reports and dashboards. To publish your process click the publish button in the view mode of your event based process.
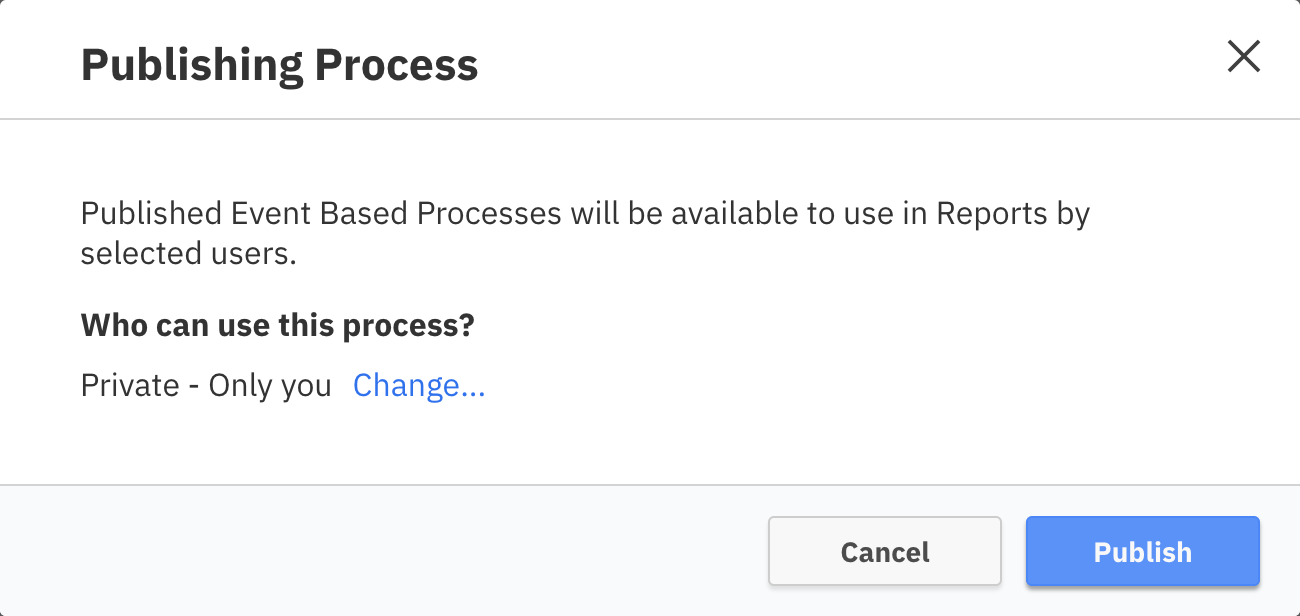
In the shown modal, you can see who will have access to use the event based process. By default, the process is only available by the user who created it. If you would like to allow other users to use the process in reports, click on ‘Change…’ to open the permissions options.
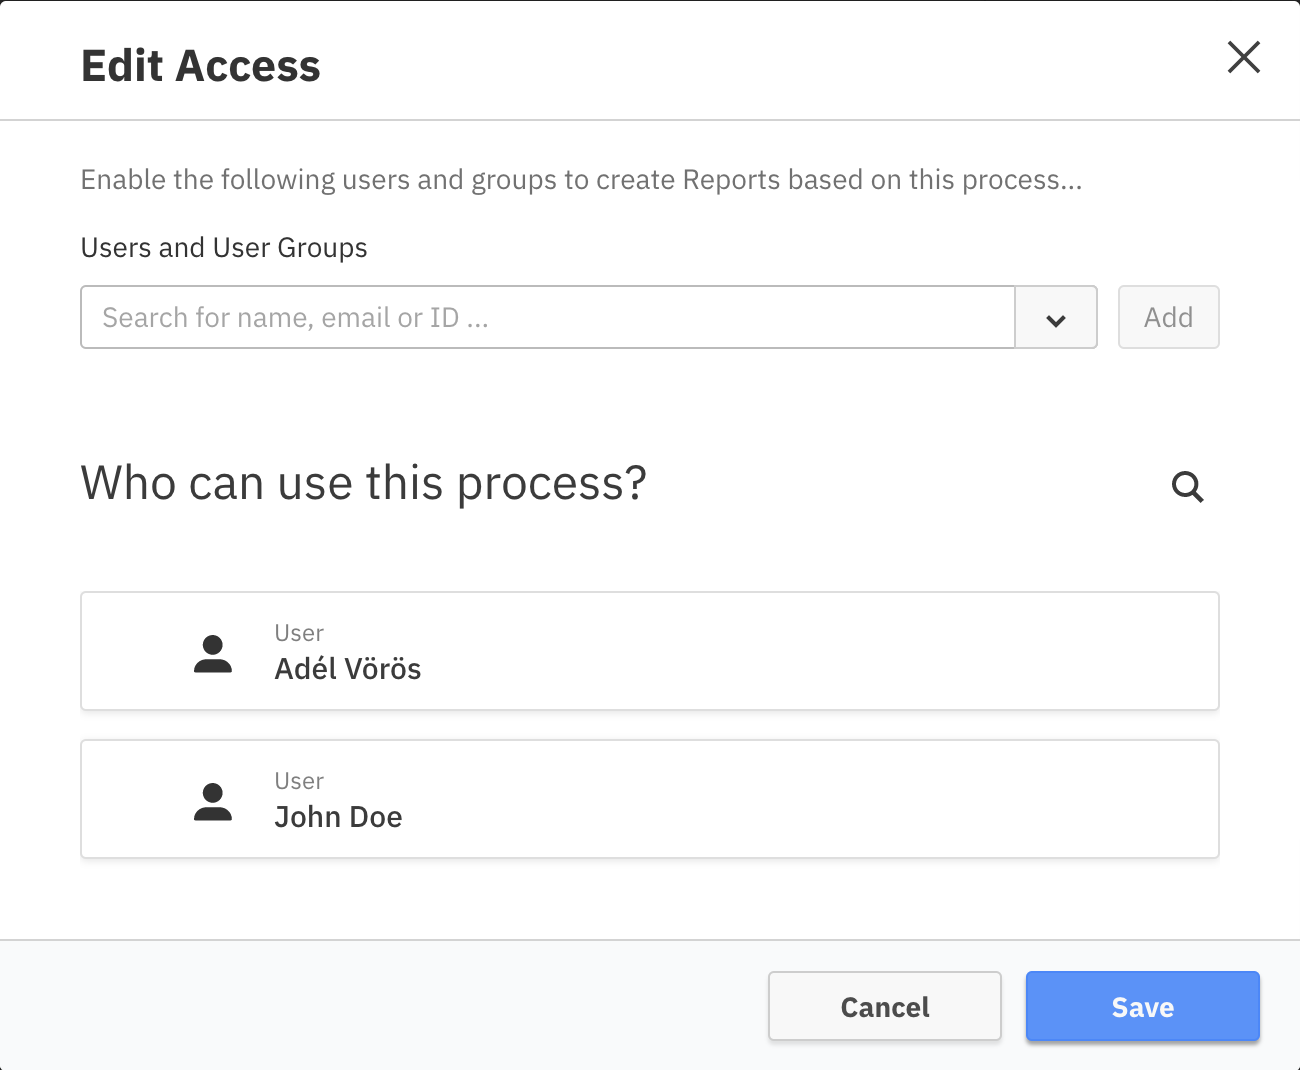
In this modal, it is possible to search for users and groups and add them to the list of users who has access to the process. Once that is done, you can save the changes and publish your process.
Publishing the process will take some time to correlate all events and generate your event based process. Once the publishing is done, a notification will appear indicating that.
Now the process is ready and can be used like any other process to create reports and dashboards.
Additional Notes
In some scenarios, Reports created using Event Based Processes might not show all the information expected. To avoid this, we encourage you to avoid including the following elements when modelling your Event Based Processes:
- Inclusive Gateways: These may be modelled in an Event based process diagram, however visual data flow will be interrupted on reports such as heat maps.

- Complex Gateways: These may be modelled in an Event based process diagram, however visual data flow will be interrupted on reports such as heat maps.

- Mixed Gateway directions: Mixed gateways are gateways which have no clear direction, instead being a combination of opening and closing gateways. These may be modelled in an Event based process diagram, however visual data flow will be interrupted on reports such as heat maps.
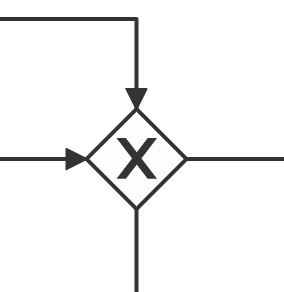
- Chained gateways: A chained gateway is one that occurs as part of a sequence of consecutive gateways. These may be modelled in an Event based process diagram, however visual data flow will be interrupted on reports such as heat map.
