Import Overview
Architecture Overview
In general, the import assumes the following setup:
- A Camunda engine, where the data is imported from.
- The Optimize back-end, where the data is transformed to an appropriate format for efficient data analysis.
- Elasticsearch, which is the database of Optimize, to where the formatted data is persisted.
The following depicts the setup and how the components communicate with each other:
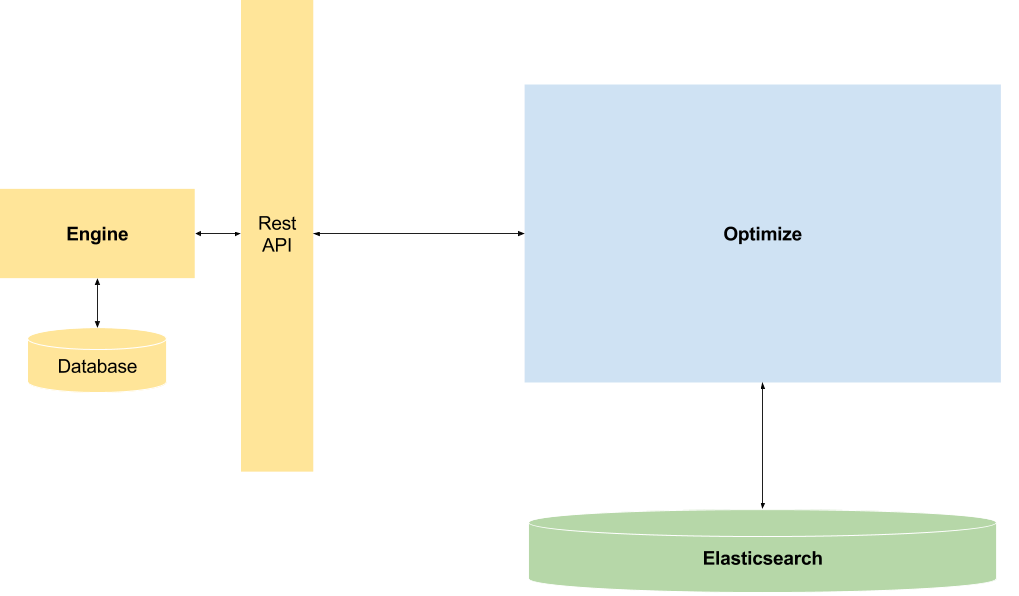
Hereby, the main idea is that Optimize queries the engine data using a dedicated Optimize REST-API within the engine and transforms the data such that it can be quickly and easily queried by Optimize. The reason of having an own REST endpoint for Optimize is peformance: the default REST-API adds a lot of complexitity to retrieve the data from the database, which results in cases with a large data sets in low performance.
Furthermore, one should be aware of what the general requirement for the data in Optimize are:
- The data is only a near real-time representation of the engine database. That means, Elasticsearch may not contain the data of the most recent time frame, e.g. the last two minutes, but all the previous data should be synchronized.
- Optimize imports only the data that it needs for its analysis. The rest is omitted and won’t be available for further investigation. Currently, Optimize imports:
- the history of the activity instances.
- the history of the process instances.
- the history of variables with the limitation that Optimize only imports primitive types and keeps only the latest version of the variable.
- process definitions.
- process definition xmls.
If you are interested in the performance of the import, have a look at the next section. How the import works in detail, is described in detail in the designated section Import Procedure.
Import performance overview
This section gives an overview of how fast Optimize imports certain datasets to get a feeling of the import speed of Optimize and if it meets certain demands.
It is very likely that this changes on different datasets, e.g. the speed of the import depends on how the data is distributed. Also how all involved components are set up has an impact on the import. For instance, if you deploy the Camunda Platform on a different machine than Optimize and Elasticsearch to provide both applications with more computation resources the process is likely to speed up or if the Camunda Platform and Optimize are physically far away from each other, the network latency might slow down the import.
Setup
The following components were used within the import:
| Component | Version |
|---|---|
| Camunda Platform | 7.9.1 on a Tomcat 8.0.47 |
| Camunda Platform Database | PostgreSQL 9.6 |
| Elasticsearch | 6.0.0 |
| Optimize | 2.1.0 |
The Optimize configuration with the default settings was used, as described in detail in the configuration overview.
All three of the following components were running on a single laptop:
- Processor: Intel® Core™ i5 (6. Generation),6440HQ Processor,4x 2.60 GHz
- Working Memory: 16 GB (DDR4)
- Storage: 192 GB (SSD)
The time was measured from the start of Optimize until the whole import of the data to Optimize was finished.
Large size data set
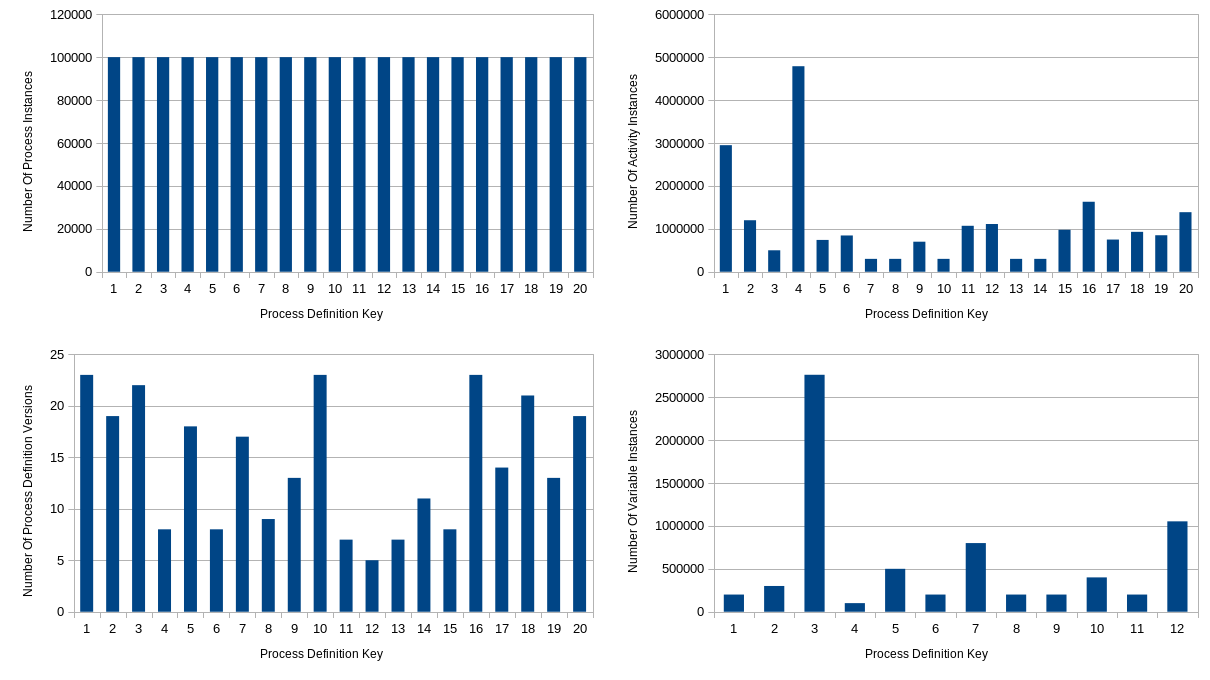
This dataset contains the following amount of instances:
| Number of Process Definitions | Number of Activity Instances | Number of Process Instances | Number of Variable Instances |
|---|---|---|---|
| 20 | 21 932 786 | 2 000 000 | 6 913 889 |
Here you can see how the data is distributed over the different process definitions:
Results:
- Duration of importing the whole data set: ~ 30 minutes
- Speed of the import: 12 000 - 16 000 database rows per second during the import process
Medium size data set
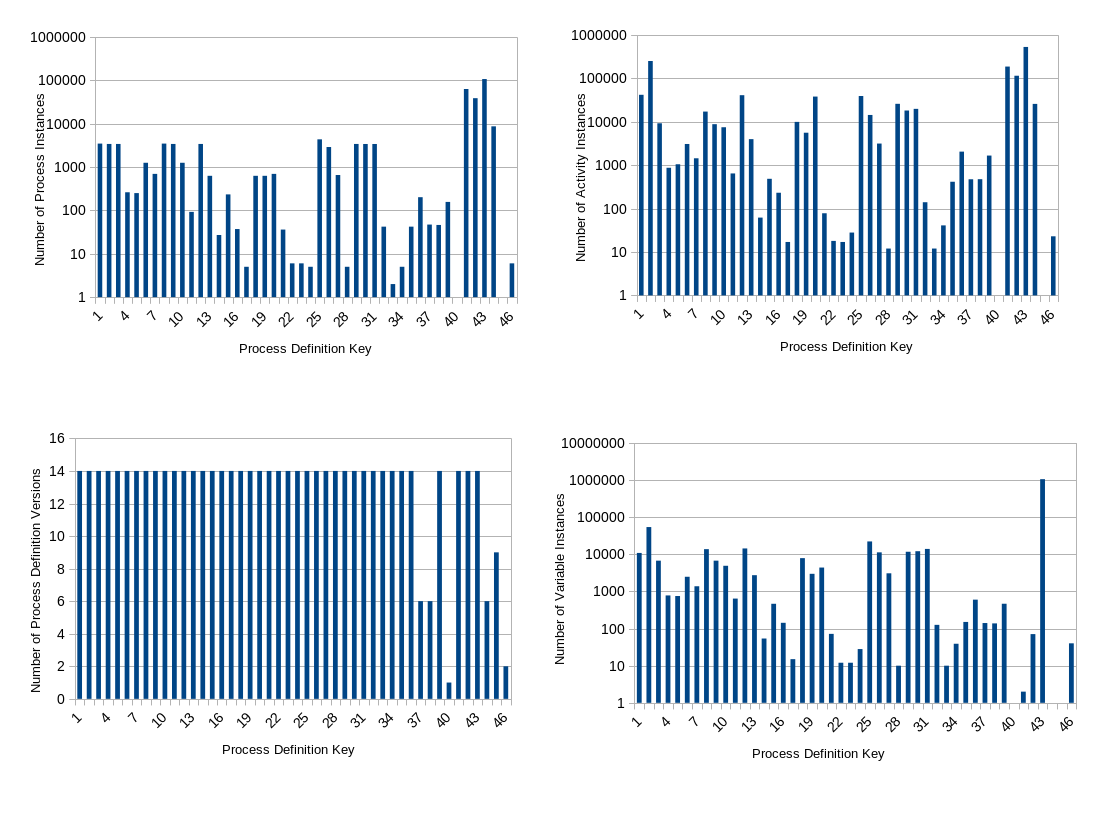
This dataset contains the following amount of instances:
| Number of Process Definitions | Number of Activity Instances | Number of Process Instances | Number of Variable Instances |
|---|---|---|---|
| 46 | 1 427 384 | 261 106 | 1 273 324 |
Here you can see how the data is distributed over the different process definitions:
Results:
- Duration of importing the whole data set: ~4 minutes
- Speed of the import: 10 000 - 15 000 database rows per second during the import process
Small data set
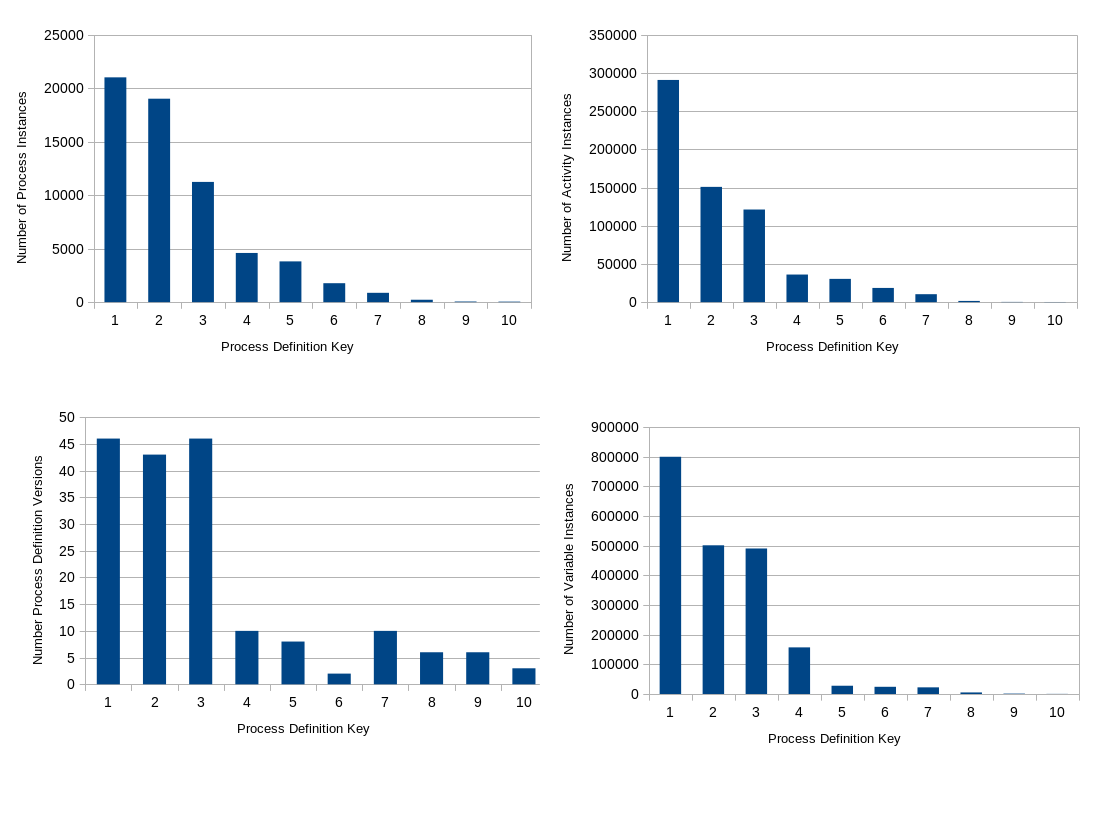
This dataset contains the following amount of instances:
| Number of Process Definitions | Number of Activity Instances | Number of Process Instances | Number of Variable Instances |
|---|---|---|---|
| 10 | 777 340 | 73 487 | 2 387 146 |
Here you can see how the data is distributed over the different process definitions:
Results:
- Duration of importing the whole data set: ~2-3 minutes
- Speed of the import: 5000 - 10 000 database rows per second during the import process
Import procedure
Heads Up!
Understanding the details of the import procedure is not necessary to make Optimize work. In addition, there is no guarantee that the following description is either complete or up-to-date.
The following image illustrates the components involved in the import process as well as basic interactions between them:
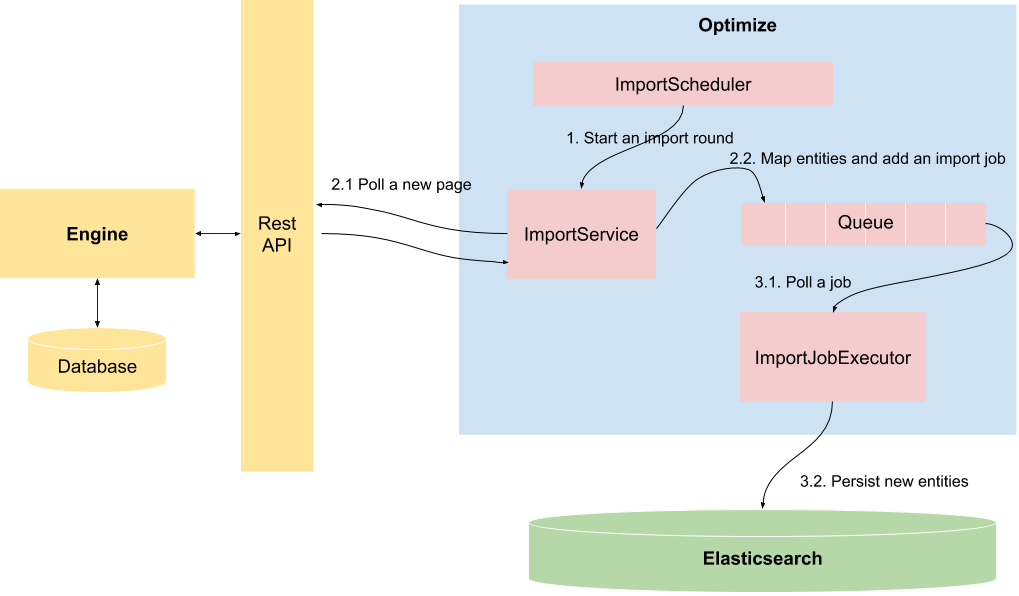
During execution, the following steps are performed:
- Start an import round
- Prepare the import
- 2.1 Poll a new page
- 2.2 Map entities and add an import job
- Execute the import
- 3.1 Poll a job
- 3.2 Persist the new entities to Elasticsearch
Start an import round
The import process is triggered automatically after startup of Optimize in a separate thread, implemented by the ImportScheduler class. The scheduler works in rounds. In each import round, multiple import services are scheduled, which are responsible for fetching one specific type of entity each, conducted by a dedicated ImportService. E.g., one service is responsible for importing the historic activity instances and another one for the process definitions.
For each service, it is checked if new data was imported. Once all entities for one import service have been imported, the service starts to backoff. To be more precise, before it can be scheduled again it stays idle for a certain period oftime, controlled by the “backoff” interval and a “backoff” counter. After the idle time has passed , the service can perform another try to import new data. Each round in which no new data could be imported, the counter is incremented. Thus, the backoff counter will act as a multiplier for the backoff time and increase the time to be idle between two import rounds. This mechanism is configurable using the following properties:
import:
  handler:
    backoff:
      # Interval which is used for the backoff time calculation.
      interval: 5000
      # Once all pages are consumed, the import service component will
      # start scheduling fetching tasks in increasing periods of time,
      # controlled by "backoff" counter.
      max: 15
If you would like to rapidly update data imported into Optimize, you have to reduce this value. However, this will cause additional strain on the engine an might influence the performance of the engine if you set the value to low.
Prepare the import
The preparation of the import is executed by the ImportService. Thereby, every ImportService implementation performs several steps:
Poll a new page
The whole polling/preparation workflow of the engine data is done in pages, meaning we only fetch a certain amount of entities. For example, we could assume that the engine has 1000 historic activity instances (HAI) and the page size is 100. As a consequence, the engine is polled 10 times. This prevents running out of memory and overloading the network.
Polling a new page does not only consist of the ImportService, but the IndexHandler and the EntityFetcher are also involved. The following image depicts how those components are connected with each other:
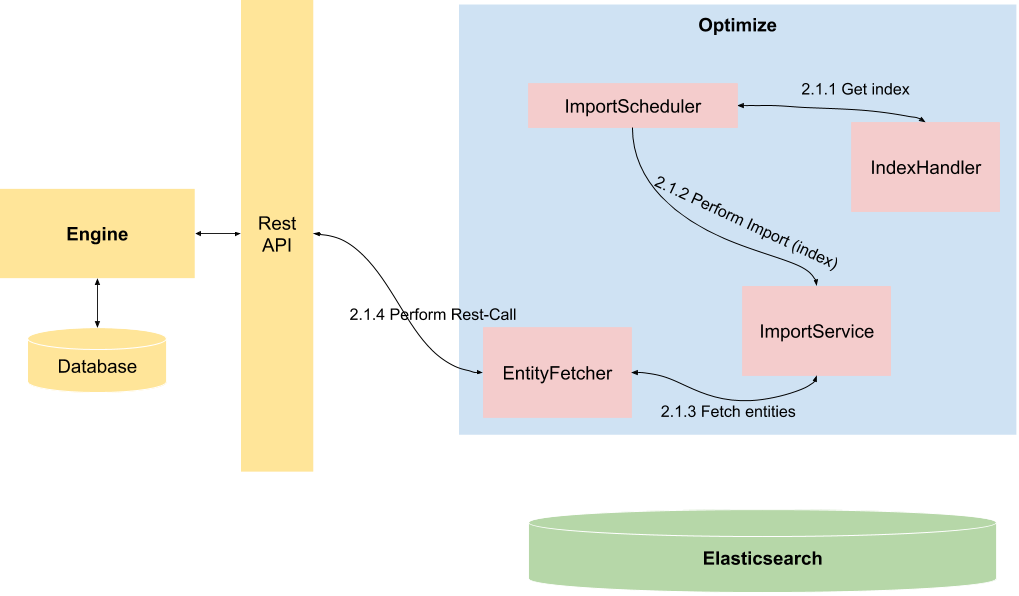
First, the ImportScheduler retrieves the newest index, which is saying where to start fetching lines in a table. This index is passed to the ImportService to order it to import a page of data. With the index and the page size, the fetching of the engine data is deligated to the EntitityFetcher.
Map entities and add an import job
All fetched entities are mapped to a representation that allows Optimize to query the data very quickly. Subsequently, an import job is created and added to the queue to persist the data in Elasticsearch.
Execute the import
Full aggregation of the data is performed by the ImportJobExecutor, which waits for ImportJob instances to be added to the execution queue. As soon as a job is in the queue, the executor
- polls the job with the new Optimize entities
- persists the new entities to Elasticsearch.
The data from the engine and Optimize do not have a one-to-one relationship, i.e., one entity type in Optimize may consist of data aggregated from different data types of the engine. For example, the historic process instance is first mapped to an Optimize ProcessInstance. However, for the heatmap analysis it is also necessary for ProcessInstance to contain all activities that were executed in the process instance. Therefore, the Optimize is an aggregation of the engine’s historic process instance and its historic activity instances (and more, but we leave that here aside for the sake of simplicity).
Also note that the Start/Preparation and the execution are actually independent from another. They follow a producer-consumer-pattern, where the ImportService is the producer and the ImportJobExecutor is the consumer. So, both are executed in different threads. To adjust the processing speed of the executor, the queue size and the number of threads that process the import jobs can be configured:
import:
  # Number of threads being used to process the import jobs that are writing data to elasticsearch.
  elasticsearchJobExecutorThreadCount: 2
  # Adjust the queue size of the import jobs that store data to elasticsearch.
  # A too large value might cause memory problems.
  elasticsearchJobExecutorQueueSize: 100